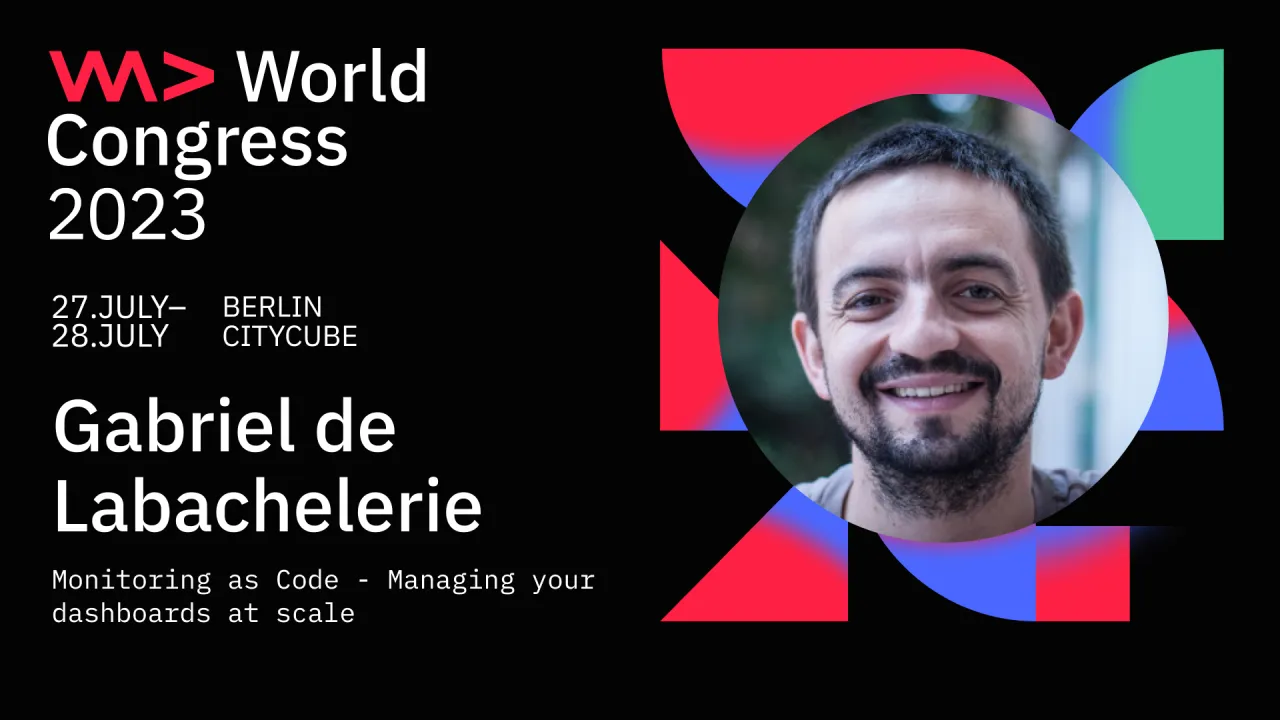

Monitoring as Code - Managing your dashboards at scale
Microstage 2
Talk
DevOps
Information
In this session we'll present how Amadeus went to create a painless, yet complete approach to get code-defined dashboards and alerts, based on Prometheus and Grafana.
To achieve this, we built a comprehensive tool chain and applied industry standard practices applied to our monitoring assets (jsonnet source code, unit and integration testing, dashboard linting, CI/CD pipeline, shared libraries, ...). Thousands of dashboards and alerts are regularly built and deployed using our "as code" solution, and are supporting the daily activities of DevOps engineers, incident management groups, customer support teams (and more...). Our approach fosters standardization, quality and maintainability, still promoting speed and agility, with one main goal: provide the right data, to the right user, at the right time.
Through a detailed presentation of our solution, we hope to share insights on how one can manage monitoring the way it deserves: as production critical software.
